Nawigacja

Control Proceedings Department

Control Proceedings Department

Number of Control Activities                                                      Individuals Subjected to Control Activities
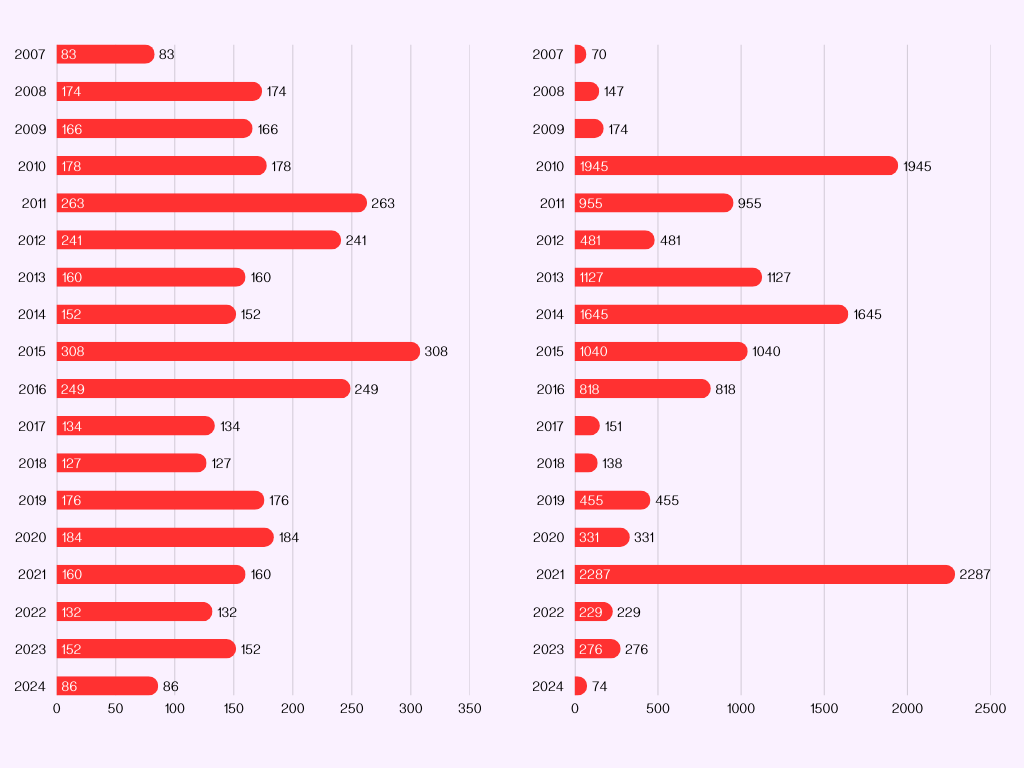
A chart displaying statistics from the Department of Control Proceedings of the CBA regarding the number of control activities and individuals subjected to control procedures from 2007 to 2024. The left side of the chart shows the number of control activities, with the highest value in 2015 (308) and the lowest in 2024 (86). The right side of the chart presents the number of individuals subjected to control, with the highest value in 2021 (2287) and the lowest in 2024 (74). The chart features red bars representing the figures for each year.

The charts present data on the number of activities and the number of people covered by control activities carries out by the Control Proceedings Department in the years 2007-2024.

go up