Nawigacja

Regional Office in Wrocław

Regional Office in Wrocław

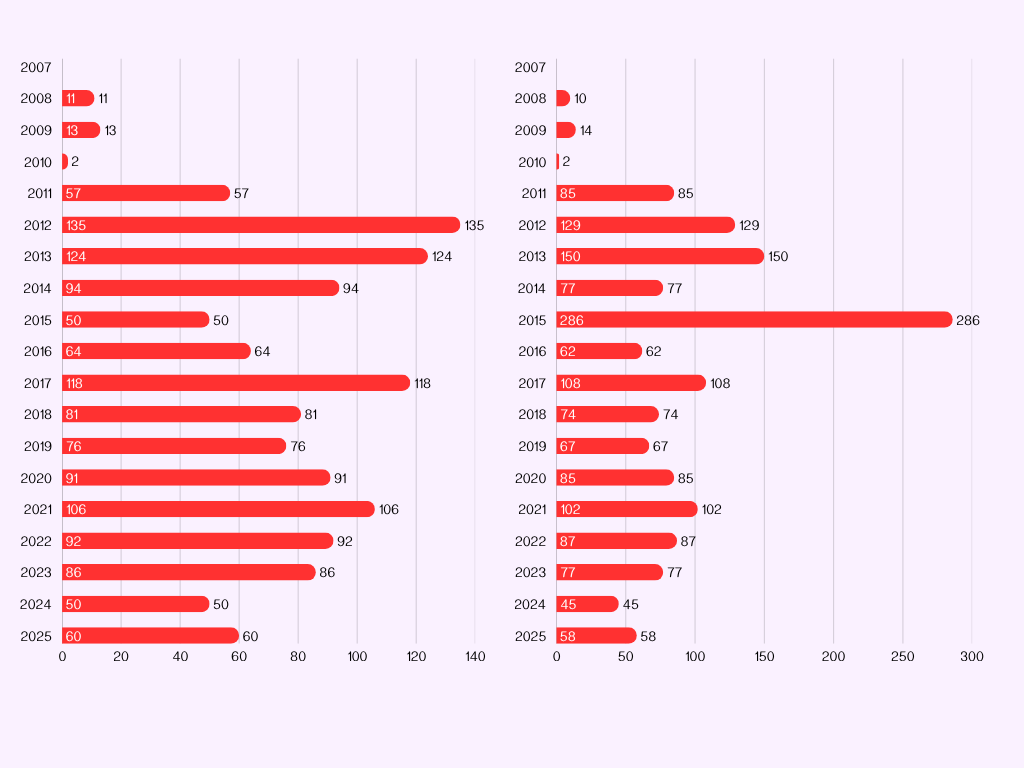
Number of Control Activities                                                       Individuals Subjected to Control Activities

A bar chart showing the number of control activities and the number of people subjected to control activities from 2007 to 2024. On the left side, the data represents the number of control activities, while on the right, it represents the number of people involved. The highest number of control activities was recorded in 2012 (135), while the highest number of people subjected to control was in 2015 (286). In the following years, these values fluctuated, reaching 61 controls and 56 people in 2024.

The charts present data on the number of activities and the number of people covered by control activities carries out by the Regional Office in Wrocław in the years 2007-2024.

go up